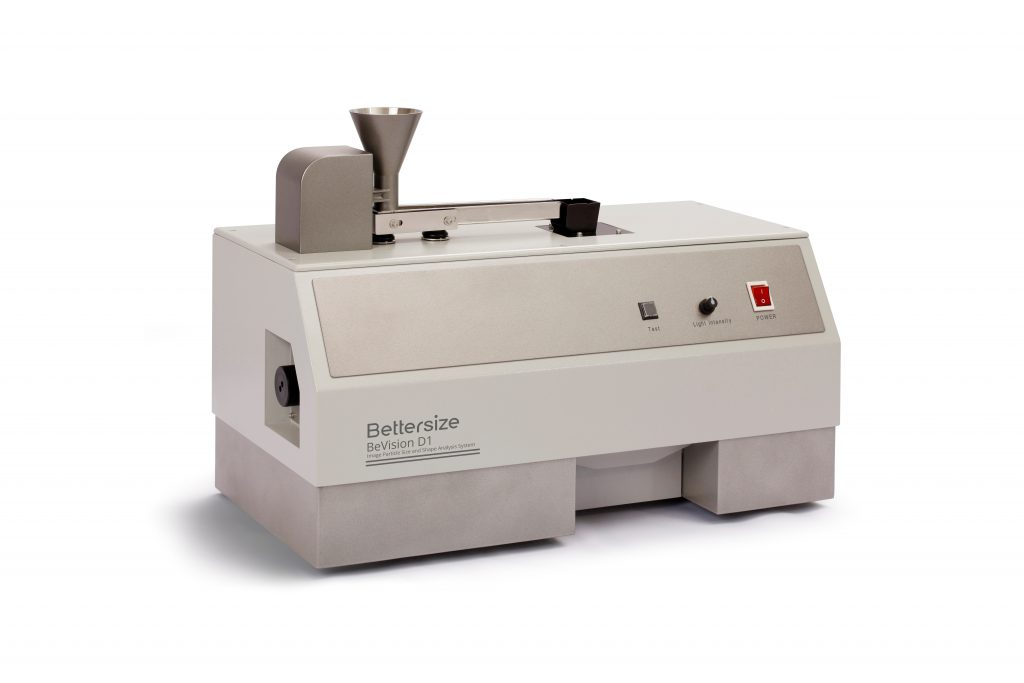
Introduction of BeVision D1
BeVision D1 dry image particle size and shape analysis system mainly applies to the analysis fields of particle size and particle shape of coarse and granular material. It adopts advanced hardware technology including electromagnetic vibration feeding system, high light LED array light source, imported high speed CCD, little phrase difference telecentric lens, etc. During the process of free falling of particles, shoot particle images which pass the lens randomly. Meanwhile, software quickly recognizes and processes particles, and screen displays images, particle size and particle shape data for each particle in real time. As it adopts high-speed CCD that can reach 100 frame/min, thousands of particles can be shot and processed per minute, and image process software can recognize and extract adhesive particles automatically. These technologies improve analysis speed, precision and accuracy of particle image greatly.
Application of BeVision D1
-Applies to analyze granular samples between 30 um to 10 mm, such as salt, sugar, plastic products, catalyst, abrasive, carbon products, sand, coal, coffee, refractory, food, polystyrene, glass, ceramics, fertilizer, medicine, ore, etc.
-The conditions and fields which BeVision D1 is not applicable: a) Fine powders, generally refer to the samples that D50 is less than 30 um, such as metal ore powders, cement etc. b)Slurry, paste and strong adhesive granular materials such as ion exchange resin and wet sand. c) Products that can physically or chemically react with the air. d) Samples which contain particles that particle size is more than 10 millimeter or less than 30 micron.
Repeatability
Excellent repeatability is achieved thanks to:
- Stable and effective feeding system.
- Stable and reliable CCD image transmission system.
- Intelligent software can identify over 10000 particles per minute, automatic reorganization of
agglomerated powder to achieve accurate results.
Repeatability verification:
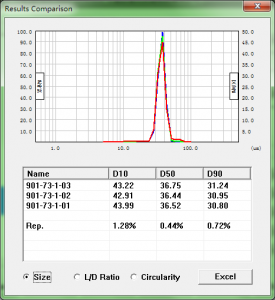
a) Repeatability of continuous tests for same sample
About Repeatability
Repeatability is primary index of particle size analyzer. It is worthless for particle size analyzer if repeatability is not good. Repeatability is related to the instrument, also, related to the operator, voltage, water quality and interference. It is a reflection of integrated factors.
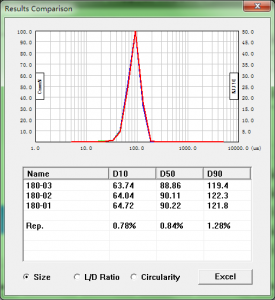
b) Repeatability of re-sampling test
Accuracy
Excellent accuracy is achieved thanks to:
- Adopts high speed CCD, it can shoot 100 images per second, and more than 10 thousand particles could be analyzed per minute.
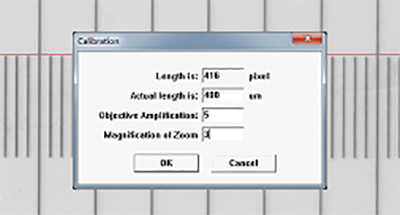
- Through the scale to calibrate the accuracy of the system, so analysis result is accurate and reliable
- Complete sample preparation system, including functions of electromagnetic vibration feeding, “particle waterfall” formed by scattering mode of particle free falling, etc.
- To filter agglomerate or adhesive particles through the function of recognizing connected particles, in order to avoid that the test result is affected.
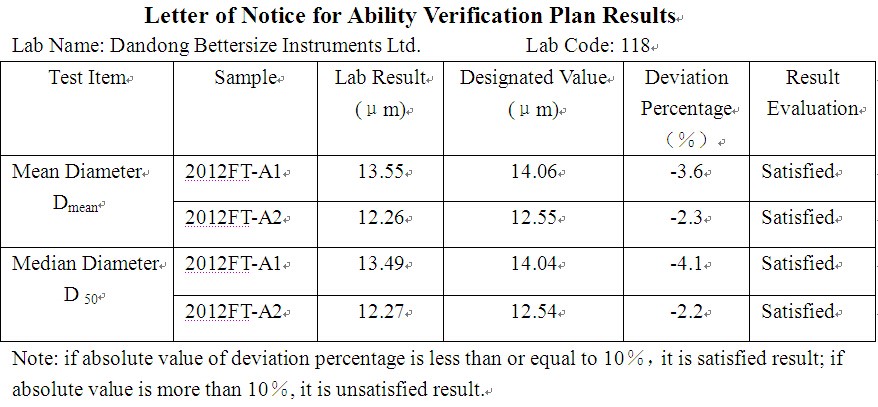
Verifications of accuracy:
a) Accuracy which approved by China National Accreditation: Satisfactory
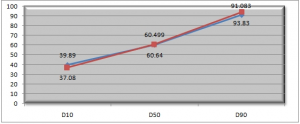
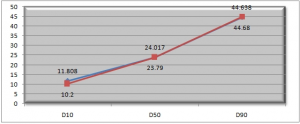
b) Test results compare with overseas advanced image analysis analyzer: Good consistency
| Sample 1 | D10 | D50 | D90 |
| Other brand | 39.89 | 60.499 | 91.083 |
| Bettersize | 37.08 | 60.640 | 93.880 |
| Sample 2 | D10 | D50 | D90 |
| Other brand | 11.808 | 24.017 | 44.638 |
| Bettersize | 10.200 | 23.790 | 44.680 |
c) Use Bettersize standard for Verification
Reliable performance and easy operation
Reliable performance is achieved thanks to:
 - Use of high quality components.
- Components are inspected and recorded for traceability. A 48-hour failure test before instruments leaves the factory.
- Use of advanced technologies such as dry burning-resistant ultrasonic, auto alignment, dew-point temperature detecting and others
- Comply with CE, FDA 21 CFR Part 11 and ISO 9001-2008 certification.
Easy operation:
Auto inflow, auto feeding, continuous testing, conversion of report format, etc, it will take only ten minutes to learn and the result will not be affected because of different operators. Use high speed CCD to shoot image can reflect real shape of the particle from different sides. It is beneficial to calculate the real feature of the particle.
Unique technology for reliable quality
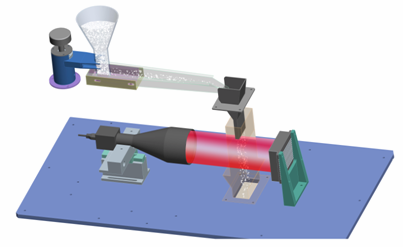
Imaging theory of free falling particle: Put sample in appropriate amount into storage hopper, and adjust distance between storage hopper and distributing trough. Then start vibration feeder, particles will flow along distributing trough and fall at the end of trough. CCD will shoot particle images quickly when particles pass the camera. Through statistics for quantity of particles and pixel quantity of each particle, to calculate equivalent circle area and equivalent sphere volume of each particle, so as to obtain the data including particle size and particle shape, etc.
Recognize connected particles:
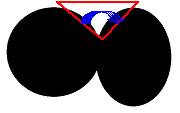 The main purpose of the function is to filter agglomerate or adhesive particles in order to avoid that the test result is affected. Connected particles refer to agglomerate particles forming by two or more than two adhesive particles. The feature of connected particles is that there is sunken area in particle image. Through judging the size, depth and angle of the sunken area, if the particles are connected particles can be recognized
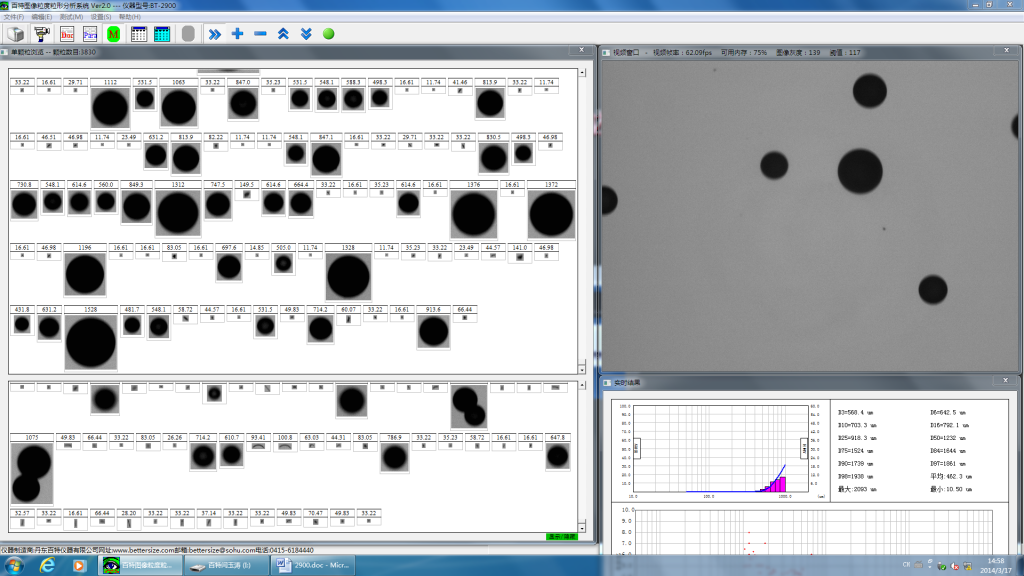
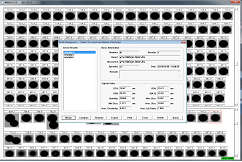
Software system:
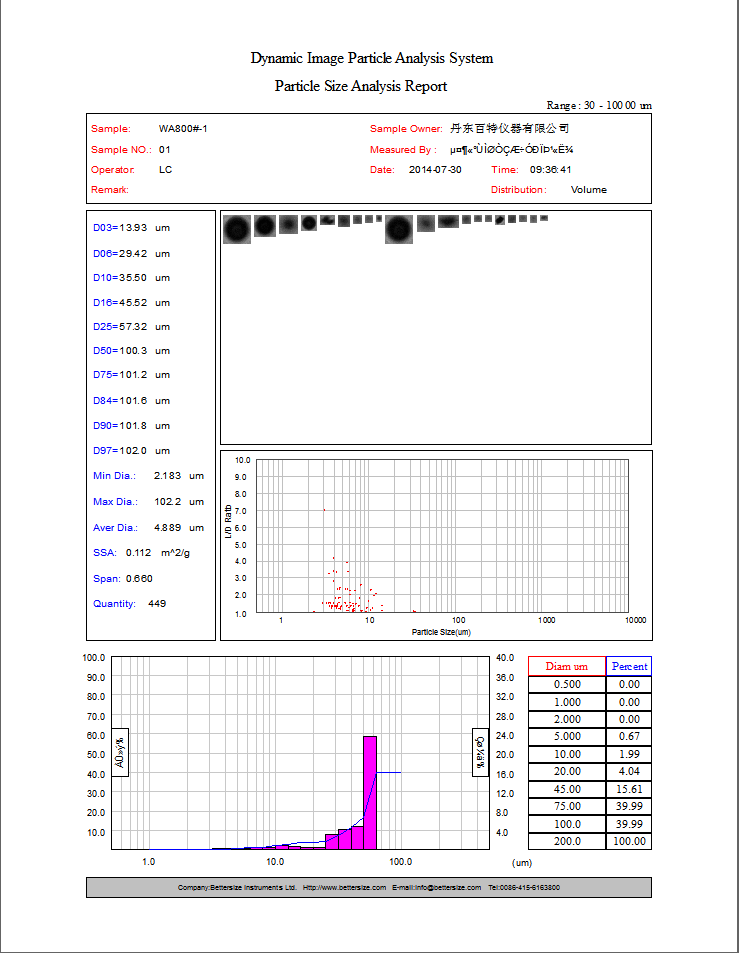
The function of BeVision D1 software system is very powerful. Herein, the report of BeVision D1 analysis result has three formats which are image + table + histogram, image + histogram and table + histogram. Users could choose them according to their requirement, or edit other formats. The report can be converted to the formats of PDF, BMP, Word, Excel and so on easily, which is convenient for communication such as E-mail, etc.
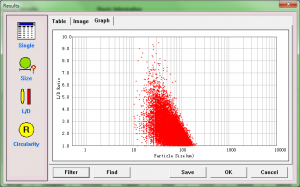
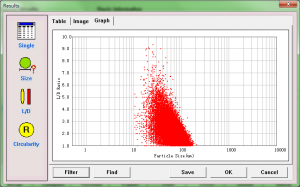
Analysis theory:
Through the statistics of pixel quantity of each particle, to calculate projected area of each particle image, then calculate circle area and sphere volume which is equivalent to real particle area, and calculate equivalent area diameter and equivalent volume diameter of the particle. Then conduct statistics for all particles by these, finally, get the information of particle size distribution, L/D ratio distribution, circularity, etc.
Examples for report type (multiple types are optional)